You are hereBig Bang Graphical Timeline
Big Bang Graphical Timeline
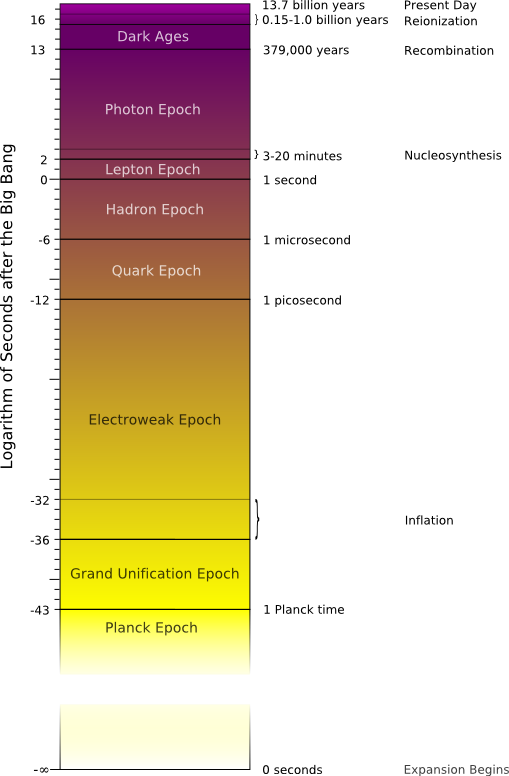
Note that this on a logarithmic time scale. This means that each tick of the scale is ten times larger than the next lower tick. For example, the tick that would be labeled "1" represents 10 seconds after the Big Bang while the tick labelled "0" represents only 1 second after the Big Bang. A little confusing perhaps, but this is the only way to display all of these time periods with such different durations on one scale.
 This work is licensed under a Creative Commons Attribution-Share Alike 3.0 United States License.
